HomeAuto COVID Hits All 50 States: CDC’s Wastewater Baseline Makes Rising Wave Look Routine
COVID Hits All 50 States: CDC’s Wastewater Baseline Makes Rising Wave Look Routine
August 23, 2026:
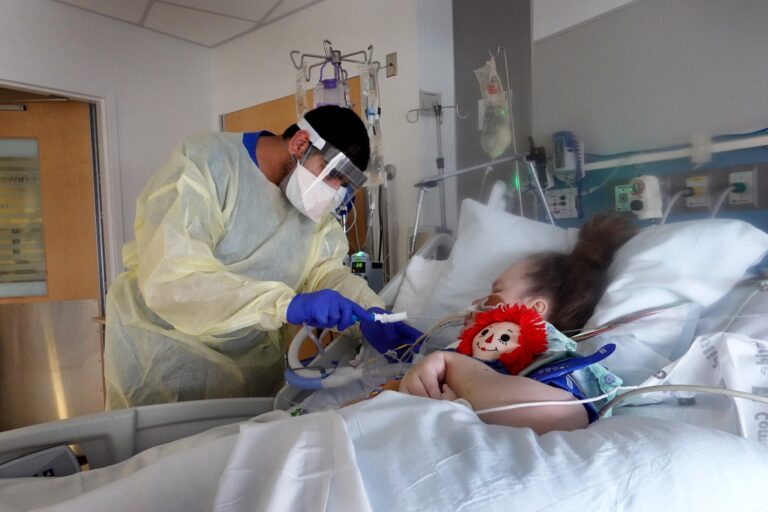
Respiratory Therapist Adel Al Joaid treats Melissa Wartman, a COVID-19 patient, in the ICU at Rush University Medial Center on January 31, 2022 in Chicago, Illinois. Scott Olson/Getty Images
The summer 2026 COVID wave has now spread into every state in the country — and the two surveillance networks most Americans could use to track it are issuing contradictory assessments of how serious it is. The Centers for Disease Control and Prevention’s epidemic trend model estimates that COVID-19 infections are growing or likely growing in 47 states as of August 19, with none declining and none holding steady. A week earlier, the same model put the wave at all 50 states simultaneously — up from 37 states as recently as July 22. At the same time, the CDC’s wastewater surveillance tracker rates national SARS-CoV-2 activity as “very low.” Stanford University’s WastewaterSCAN program, which monitors the same virus in the same sewers using a different methodology, rates national activity as “high” — with viral concentrations in August running 106 percent above July levels.
Both networks are legitimate. Neither is wrong. But a reader deciding whether to wear a mask at a family gathering or postpone a visit to an elderly parent cannot reconcile a 106-percent viral increase with a “very low” official rating using a single national number. Understanding why those two readings exist — and which one better reflects where the wave is right now — is the most practically useful thing this article can give you.
The variant picture has shifted since this summer’s surge began. NB.1.8.1 — nicknamed “Nimbus” — drove the wave’s initial acceleration and by late June 2026 accounted for an estimated 43 percent of sequenced American COVID cases, according to CDC genomic surveillance data.
XFG.1.1 Is Now the Wave’s Primary Driver
Nimbus is now in second place. XFG.1.1, informally called “Stratus,” has overtaken it: the recombinant strain now accounts for an estimated 22 to 40 percent of all US cases, according to the latest CDC genomic data.
“It’s still within the family of past Omicron variants from this past year, so it’s not a big jump in terms of being different,” Dr. Albert Ko, professor of public health, epidemiology, and medicine at Yale School of Public Health, told TODAY.com in an August interview. Both XFG and Nimbus descend from the JN.1 Omicron lineage, and both carry spike protein mutations that enhance immune evasion and transmissibility without corresponding evidence of increased severity. Symptoms from XFG infections follow the Omicron-era pattern: sore throat, cough, fatigue, congestion, fever, body aches, and occasional nausea or diarrhea. The FDA voted in May 2026 to select XFG as the 2026-2027 vaccine strain, meaning the upcoming COVID shot will be matched to the variant now driving the US wave.
A third variant, BA.3.2 — nicknamed “Cicada” — is circulating in wastewater across more than 30 states and accounts for roughly 15 percent of current US cases, according to CDC genomic data. Cicada carries more than 70 spike protein mutations that could theoretically aid immune evasion, which has made public health officials flag it for enhanced monitoring. It has not caused a dramatic clinical surge in the United States so far, but its mutation profile means surveillance will continue.
Why the Two Wastewater Systems Disagree
The measurement discrepancy between CDC and WastewaterSCAN is the most important thing to understand about the current surveillance picture — not because either system is malfunctioning, but because they are measuring the same thing against different baselines and on different timelines, and the result is two readings that can look like opposites while both being accurate.
The CDC’s National Wastewater Surveillance System covers approximately 1,500 testing sites and compiles data from state and local health departments. Its Wastewater Viral Activity Level (WVAL) metric compares current viral concentrations at each site against “low viral levels at that location over the last 24 months,” according to the CDC’s own methodology documentation updated in April 2026. Those 24 months encompass the entire Omicron era — a period during which wastewater viral concentrations were persistently elevated, never returning to pre-pandemic baselines. When the Omicron era is the baseline, a new wave rising sharply in absolute terms can appear numerically modest relative to that elevated floor. The CDC says “very low” because current levels are not that many standard deviations above the Omicron-era normal. The system also reports on a weekly cycle with a reporting lag from sample to publication.
WastewaterSCAN, the Stanford and Emory University collaboration, monitors approximately 148 sites in 40 states. It tests wastewater solids — a more concentrated sample medium that can detect viral RNA more sensitively than liquid wastewater — and publishes data within 48 hours of collection, faster than the CDC’s weekly cycle. WastewaterSCAN’s methodology tracks current trend against site-specific recent baselines rather than against the long Omicron-era historical floor, making it more sensitive to wave onset. It says “high” with a significant upward trend because, relative to recent site-specific levels, concentrations have increased sharply.
“We’ve been seeing a pretty steady increase since late June across the US,” Amanda Bidwell, WastewaterSCAN’s scientific program manager, told TODAY in an August interview. “So far in August, SARS-CoV-2 concentrations are up 106 percent compared to July 2026.” The West and South currently show the highest concentrations, with California and Texas among the states reporting the sharpest increases.
The practical implication: WastewaterSCAN functions more like an early-warning thermometer — picking up the wave’s arrival before the CDC’s system registers it as elevated. If you are tracking this wave to make a personal decision this week, WastewaterSCAN’s daily updates at wastewaterscan.org offer a more current and potentially more sensitive signal than the CDC’s wastewater dashboard. On the CDC’s own map, Hawaii and Mississippi currently show “moderate” levels — the only states elevated above “very low” on that wastewater system.
What the Clinical Numbers Actually Show
The discrepancy in wastewater readings matters more because the other available metrics are still modest. Emergency department visits attributed to COVID-19 accounted for 0.31 percent of all ER visits for the week ending August 8. The CDC’s CovidHub ensemble forecast projects that figure rising to roughly 0.43 percent for the week ending August 22, with a 95-percent prediction interval running from 0.25 to 0.59 percent. Laboratory-confirmed hospital admissions stood at roughly 1,800 for the week ending August 8, with approximately 2,400 forecast for the week ending August 22 and a range of 1,700 to 4,000.
Those are increases. They are increases from a low baseline. Andrew Pekosz, professor of molecular microbiology and immunology at Johns Hopkins Bloomberg School of Public Health, told Newsweek the pattern is consistent with recent history: “Late summer/early fall surge of COVID cases seems to be part of the expected pattern of COVID-19 cases that we see. Cases are increasing at a relatively steady pace, they aren’t surging dramatically.” Peter Chin-Hong, professor of medicine and infectious disease specialist at the University of California, San Francisco, agreed: “This tells us that we are in a broad national wave of COVID infection. A broad national wave of COVID does not mean that there will be a lot of severely ill people, however, as the population is generally immunologically experienced. People should be aware but not alarmed.”
Dr. John Brooks, an infectious disease physician at Emory University who previously worked at the CDC, offered context for why the wave can simultaneously be growing in nearly every state and still feel invisible to many Americans: “We’re now in the midst of a growing summer surge of COVID here in the United States. I think most of us kind of feel like it’s fading away and are certainly not thinking about it.”
Who Is Actually at Risk
Risk in this wave is concentrated, not evenly distributed. The clearest data on who faces severe outcomes come from Taiwan’s summer wave — which ran two to four weeks ahead of the US on the same Nimbus-to-XFG variant trajectory — where public health officials found that 73.4 percent of severe cases involved adults 65 and older, 83.7 percent had a history of chronic illness, and 90.6 percent had not received the current season’s COVID vaccine. The pattern is consistent with what US experts describe: adults 65 and older, immunocompromised people, pregnant individuals, adults with chronic heart, lung, kidney, or liver conditions, and infants who have not been vaccinated are the groups most exposed to serious outcomes.
“These are the people I still see in the hospital,” Chin-Hong said of adults over 75, pregnant individuals, those with serious immune compromise, and unvaccinated very young infants.
For a healthy adult under 50 with no underlying conditions, a growing Rt across 47 states is a reason to stay informed, not a reason to alter plans. For households that include elderly people, people on immunosuppressive medications, or newborns, the wave warrants more attention — particularly because the fall semester is about to add a new transmission layer. “We need to be very cautious. We’re still only in the middle of August,” Dr. William Schaffner, an infectious disease specialist at Vanderbilt University, told TODAY on the back-to-school risk, noting that millions of children returning to school in the next two weeks will create new opportunities for the virus to move between households.
What to Do Before the Fall Vaccine Arrives
The current 2025-2026 COVID vaccines target LP.8.1, a JN.1 Omicron descendant closely related to both Nimbus and XFG. Health authorities from the WHO to the ECDC to US federal agencies have assessed that LP.8.1-targeted vaccines retain meaningful cross-reactive protection against severe illness from both circulating strains, even though antibody neutralization of XFG and Nimbus is modestly reduced compared to LP.8.1 itself. T-cell immune responses, which are less affected by these specific spike protein mutations, continue to provide significant protection against hospitalization.
The 2026-2027 vaccine is expected to be available in September, and it will target XFG directly — meaning the incoming shot will be better matched to the wave than the current one. “The new shots will cover what’s anticipated to be circulating this fall and winter,” Schaffner told TODAY.com.
One practical complication: the CDC’s updated vaccination guidance, introduced in 2026, now recommends COVID vaccines straightforwardly only for adults 65 and older and people with high-risk medical conditions. Adults under 65 without high-risk conditions can still get vaccinated, but the guidance now requires shared clinical decision-making with a clinician or pharmacist — a policy shift that has created an additional step for a significant share of the working-age population during an active wave.
Pekosz’s practical summary: “Prevention is the best way to deal with COVID-19. Get COVID-19 booster shots, check local pharmacies for antiviral treatments, and prepare for the approaching influenza and RSV season.”
Regardless of vaccine status, antivirals work best when started within the first few days of symptom onset. High-risk individuals should confirm with a clinician or pharmacist that they have a plan to access antivirals quickly if they test positive.
Does COVID’s Summer Wave Follow a Predictable Seasonal Pattern?
COVID now exhibits what epidemiologists describe as dual seasonality — two annual summer-winter wave cycles — that have made it unlike influenza, which peaks once in cold-weather months. The leading explanations involve waning immunity from winter infections, a new immune-evasive variant gaining transmission advantage, increased indoor crowding as heat drives people toward air conditioning, and summer travel mixing populations from different regional immunity landscapes.
The 2026 wave is the fourth consecutive summer resurgence. The CDC’s 2026 Summer Outlook predicted it — the agency forecast that populations in the South and West, which had relatively limited COVID exposure during the 2025-2026 winter, would enter summer with thinner immunity buffers and experience the earliest and most significant surge. That prediction has proven accurate: the West and South are still the regions showing the highest concentrations in both wastewater networks. What the Outlook did not fully anticipate was the speed with which the wave would become national: the jump from 37 states to 47-50 states in roughly three weeks has been faster than prior years’ late-summer expansions.
Frequently Asked Questions
Why do the CDC and WastewaterSCAN show such different levels of COVID activity right now?
The two programs measure viral activity against different baselines. The CDC’s National Wastewater Surveillance System compares current concentrations to the prior 24 months of data — a period that includes the sustained Omicron era of 2022-2025, when wastewater viral levels were perpetually elevated and never truly returned to pre-pandemic lows. A new wave climbing sharply in absolute terms can still appear modest relative to that elevated historical floor, producing a “very low” reading. WastewaterSCAN, the Stanford-based program, uses a site-specific trend approach that is more sensitive to wave onset and reports data within 48 hours rather than on a weekly lag. It classified national activity as “high” with a significant upward trend because concentrations have risen sharply relative to site-specific recent baselines. Neither is wrong. They are measuring different things — and for tracking whether a wave is arriving right now, WastewaterSCAN’s faster, trend-sensitive method is likely giving you more current information. For a deeper look at how these two systems differ, the Medical Daily coverage from August 21 has a useful breakdown.
What are the symptoms of XFG (Stratus) and how does it differ from Nimbus?
Both XFG.1.1 and NB.1.8.1 (Nimbus) are JN.1 Omicron descendants with similar symptom profiles: sore throat, cough, fatigue, nasal congestion, fever, body aches, and occasional nausea or vomiting. XFG is sometimes described as producing a hoarse or scratchy throat, while Nimbus attracted early clinical attention for a “razor-blade” throat sensation. Neither variant has demonstrated higher rates of severe illness, hospitalization, or death compared to recent Omicron predecessors. The key practical difference is that XFG has overtaken Nimbus as the dominant strain and is the strain the FDA selected as the target for the 2026-2027 fall vaccine — meaning the updated shot arriving in September will be better matched to what is actually circulating than the current vaccine is.
Who should take action now, and what should they do?
Adults 65 and older, immunocompromised individuals, pregnant people, and adults with chronic heart, lung, kidney, or liver disease or diabetes face the most elevated risk of severe outcomes and should take action now rather than waiting for the fall vaccine. Three practical steps: confirm vaccination status and discuss current-season eligibility with a clinician or pharmacist; make sure you have a plan to access antiviral medication quickly if you test positive, because antivirals work best when started within the first few days; and keep COVID tests on hand rather than searching for them mid-illness. For lower-risk adults, the wave is a reason to stay informed and to be especially protective of higher-risk people in your household as the back-to-school season intensifies indoor transmission starting in late August. The CDC’s current vaccination guidance outlines eligibility and shared decision-making steps for adults under 65.
How worried should parents be about Cicada (BA.3.2), and is it more dangerous than XFG?
Cicada (BA.3.2) is being monitored carefully because it carries more than 70 spike protein mutations that give it a theoretically significant immune-evasion profile — greater than either XFG or Nimbus. It has been detected in wastewater across more than 30 states and currently accounts for roughly 15 percent of US cases, according to CDC data. However, Cicada has not produced a dramatic clinical surge in the United States so far, and there is no current evidence that it causes more severe illness than other circulating variants. Its mutation count makes it worth watching, but the surveillance picture right now points to XFG as the dominant strain and the primary driver of this wave. Parents should follow standard guidance — vaccination, testing when symptomatic, and early access to antivirals for high-risk family members — regardless of which specific variant is circulating. The CDC’s early surveillance report on BA.3.2 provides further context on the variant’s spread and immune-evasion characteristics.