HomeAuto Nearly Half of Investors Expect Bear Market: History Says They Will Be Wrong
Nearly Half of Investors Expect Bear Market: History Says They Will Be Wrong
August 31, 2026:
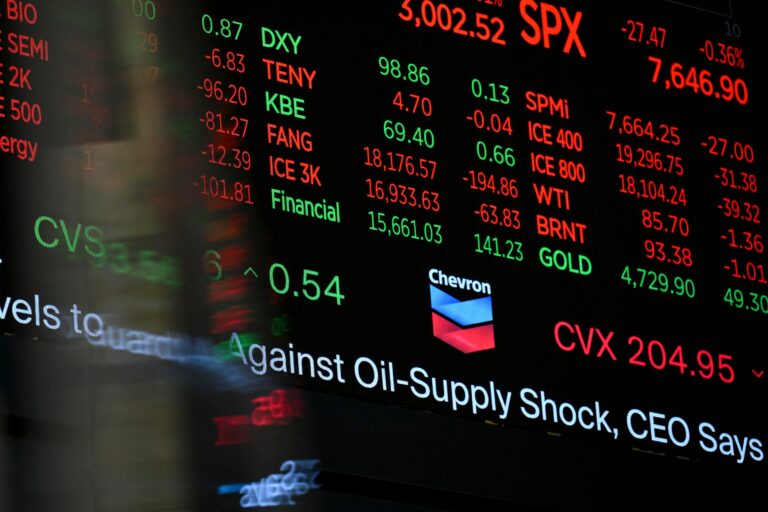
A Chevron signage is displayed on a digital screen at the New York Stock Exchange (NYSE) during morning trading on August 24, 2026 in New York City. ANGELA WEISS/AFP via Getty Images
When nearly half of individual investors expect the stock market to fall in the next six months, history has a consistent and emphatic reply: that peak fear has reliably marked the wrong moment to sell, and the right moment to buy. For the week ending August 26, 2026, the American Association of Individual Investors’ weekly sentiment survey recorded 44.4% of respondents as bearish on the stock market’s six-month outlook — far exceeding the historical average of 31.5% and outpacing the 32.9% who remain bullish, according to the AAII Investor Sentiment Survey. That 4.5 percentage-point jump in pessimism in a single week is one of the sharpest weekly deteriorations in sentiment this year. According to AAII’s own four decades of historical data, extended periods of bearish readings above 40 to 45% have historically coincided with market bottoms and subsequent recoveries — not with the prolonged declines investors fear.
Warning Signs Are Real — and So Are Their Limits
The anxiety is not unfounded. Several closely watched valuation metrics are signaling elevated risk. The Buffett Indicator — the ratio of total U.S. stock market capitalization to GDP, which legendary investor Warren Buffett in a 2001 Fortune magazine article called “probably the best single measure of where valuations stand at any given moment” — sat at approximately 236.5% as of late August 2026, according to GuruFocus data. CurrentMarketValuation.com, which applies a trend-adjusted methodology, calculated the figure at 244% as of June 30, 2026, placing it roughly 2.6 standard deviations above the historical trend line — a reading it classifies as “Strongly Overvalued.”
The S&P 500’s Shiller Cyclically Adjusted Price-to-Earnings ratio — which smooths earnings over a 10-year inflation-adjusted period — is similarly elevated at around 41, its second-highest reading in history behind the dot-com bubble peak.
Buffett himself addressed these conditions directly during Berkshire Hathaway’s 2026 annual meeting, sitting down with CNBC’s Becky Quick on May 2. Speaking from the audience as Berkshire’s chairman — he had stepped down as CEO at the start of the year — Buffett compared financial markets to “a church with a casino attached,” warning that speculative short-term trading had reached historic levels. “The casino has gotten very attractive to people,” Buffett told CNBC. “That’s not investing, it’s not speculating, it’s gambling. Just totally.” He added: “We’ve never had people in a more gambling mood than now. But that doesn’t mean that investing is terrible. It does mean that prices for an awful lot of things will look very silly.”
These are genuine signals of caution — but not signals of inevitability. The Buffett Indicator has remained elevated since at least 2015 without reliably predicting near-term crashes; critics note that U.S. companies now earn roughly 41% of their revenues overseas, which inflates market capitalization relative to the domestic GDP denominator. And Buffett’s own record — Berkshire holds $397 billion in cash and Treasuries, its largest-ever position — reflects selective abstention from overpriced assets, not a belief that investing itself is broken.
What History Actually Shows About Bear Markets
Despite the elevated anxiety, market analysts at The Motley Fool have published the most relevant counter-argument this weekend: a century of U.S. market data that runs in a single, consistent direction.
Every bear market in U.S. history — defined as a decline of more than 20% in a broad-market index — has shared one universal and defining trait: it ended, and was followed by a bull market that more than recouped the losses. Not in some cases. In all of them, per Motley Fool analyst John Bromels.
Since the S&P 500’s creation in 1957, the index has been in a bear market for approximately 12 total years. It has been in a bull market for approximately 57 total years. Bullish conditions have prevailed roughly 83% of the time.
The gap in returns is even more striking. Of the 13 bull markets since the S&P 500’s creation, only one — the 1966 to 1968 rally — returned less than 1.9 times the losses of the preceding bear market. Most returned considerably more. The 1982 to 1987 bull market returned roughly nine times the losses of the 1980 to 1982 downturn. The 1990 to 2000 bull market — one of the longest in history — delivered approximately 21 times the losses of the 1990 bear market.
The most catastrophic crashes have been followed by the most powerful recoveries. The dot-com bust produced the longest bear market in S&P 500 history, lasting 31 months from peak to trough between March 2000 and September 2002. The bull market that followed lasted 60 months and more than recovered the losses. The Great Recession’s 17-month bear market — which saw the S&P 500 fall 56.8% — gave way to the longest bull market on record, which ran for nearly 11 years. The COVID-19 crash of February 2020, the fastest 30% decline in market history at just 22 trading days, produced one of history’s most decisive short-term recoveries.
Peak Investor Fear as a Historical Buy Signal
What the data surfaces — and what the current AAII reading makes urgently relevant — is not just that bear markets end, but that the moment when most investors fear them has historically marked the wrong time to reduce equity exposure.
AAII’s own historical analysis, which spans the survey’s entire 39-year dataset from 1987 to 2026, shows that bearish sentiment readings above two standard deviations from the historical mean have preceded above-average S&P 500 returns over the following six to twelve months. The clearest historical example: on March 5, 2009, bearish sentiment hit an all-time record of 70.3%. Three days later, the S&P 500 bottomed and began what became one of the longest bull markets in history. Investors who remained in that market earned approximately 36.4% over the following six months and roughly 68.6% over the following twelve months, according to AAII’s historical extremes data.
The current 44.4% bearish reading is nowhere near that extreme, but AAII classifies extended readings above 40 to 45% as historically coinciding with market recoveries. The bull-bear spread — bearish minus bullish sentiment — now sits at negative 11.5 percentage points, against a historical average of positive 6.5 points. That kind of gap in the wrong direction has, across the survey’s history, tended to resolve by markets moving up rather than down.
The investment community’s consensus guidance for individual investors is accordingly direct: the worst decision most people can make during a downturn is to sell. Investors who sell during a crash lock in permanent losses on what has historically, without exception, proven to be a temporary decline. They also risk missing the market’s best single-session days — which cluster immediately after major downturns — compounding the damage of mistimed exits. As Motley Fool analyst John Bromels wrote in his August 29 analysis: to succeed at market timing, an investor must be right twice — exiting at the right moment and re-entering at the right moment, typically under emotional pressure and with competing information.
Buffett’s well-known maxim applies directly: “Be fearful when others are greedy, and be greedy when others are fearful.” At 44.4% bearish sentiment, the AAII data suggests that “others” are currently quite fearful indeed.
Does Bear Market Risk Arrive? Here Is What Investors Can Actually Do
For investors who want to reduce portfolio volatility without abandoning the equity market — and without betting on precise timing — research and historical screening support a range of practical moves.
Sector rotation toward defensives. Utilities, consumer staples, and financial market infrastructure firms generate stable earnings regardless of the economic cycle. CNBC Pro screened three years of performance data for S&P 500 stocks that tended to be positive on the index’s worst sessions and identified three names with meaningful analyst upside targets:
Kroger rose in nearly 70% of sessions when the S&P 500 fell sharply. The grocer has underperformed the broader market in 2026, down more than 7% year-to-date — but analysts project a rebound of more than 26% based on consensus price targets.
Southern Company, an Atlanta-based utility, was positive in 63% of significant down sessions and posted the highest median gain of the three screened names. Analysts anticipate approximately 10% upside over the next 12 months.
Cboe Global Markets, the Chicago-based financial market technology and options exchange operator, was positive in 75% of bad market days and has gained nearly 20% year-to-date. Cboe benefits directly from elevated volatility — high options volume on down days translates into revenue.
Portfolio rebalancing. Investors concerned about a prolonged downturn may consider reducing exposure to highly valued growth stocks and increasing allocations toward value equities, international stocks, small-cap funds, and dividend-paying companies with consistent earnings. Some model defensive allocations — such as Vanguard’s published guidance for more balanced investor profiles — recommend meaningfully higher bond and international equity weightings than a pure U.S.-equity approach.
Actively managed ETFs. Because portfolio managers can adjust holdings as conditions shift, actively managed exchange-traded funds offer some protection that pure index replication cannot match during high-volatility periods.
None of these moves requires predicting the precise timing of a bear market. They are structural adjustments that reduce volatility while keeping capital invested — the condition that, as the historical data confirms, is what allows recovery compounding to work.
No One Knows When — and That Is Precisely the Point
No analyst, model, or sentiment survey can specify exactly when a bear market will begin. The Buffett Indicator has flashed at elevated levels for years without triggering a crash; markets have sometimes continued climbing for extended periods after such signals appeared. Elevated valuations indicate elevated risk, not an inevitability or a timer.
What the historical record makes clear — across 69 years of S&P 500 data and 13 bull-bear cycles — is that investors who stayed the course through every bear market in that span eventually recouped their losses and went on to substantial gains. Those who sold during downturns, in almost every documented case, fared worse: they locked in permanent losses at temporary bottoms and frequently missed the recovery’s early and most powerful sessions.
The noise in late August 2026 is loud. The AAII survey has reached its most bearish reading in months. Valuation metrics are at historically elevated levels. Buffett has warned about casino culture. All of that is real. And the data — as it has for over a century — still favors patience over panic.
This article is for informational purposes only and does not constitute investment advice. Readers should conduct their own due diligence before making investment decisions.
Frequently Asked Questions
Does high bearish investor sentiment actually predict a stock market recovery?
Not with precision — but AAII’s historical dataset shows that extreme bearish readings have consistently preceded above-average S&P 500 returns over the following six to twelve months. The most dramatic example: on March 5, 2009, AAII’s bearish reading hit an all-time record of 70.3%. The S&P 500 bottomed three days later and gained approximately 36.4% over the next six months and roughly 68.6% over twelve months, according to AAII’s historical data. The current 44.4% bearish reading is below that extreme but above AAII’s stated threshold range of 40 to 45%, which has historically coincided with market bottoms and recoveries. Extreme sentiment is a probabilistic medium-term signal, not a precision timing tool — it should be used alongside valuation data and earnings trends, not in isolation.
If I sell my stocks now and the market falls, can I just buy back in at the bottom?
The historical evidence strongly argues against this approach — not because the market never falls from elevated valuations, but because successfully timing a round-trip exit and re-entry requires being right twice under emotional pressure with limited information. Investors who sold at the start of prior downturns frequently missed the market’s best recovery days, which cluster immediately after major declines. A $1,000 investment in the S&P 500 at the start of 2006, with dividends reinvested, grew to roughly $6,200 by 2026 even after weathering the Great Recession, the COVID crash, and the 2022 rate-hike bear market. The same amount in 20-year Treasuries grew to only roughly $1,500.
Which specific types of stocks have held up best during S&P 500 down sessions?
CNBC Pro’s screening of three years of S&P 500 performance data identified three names that rose on the vast majority of the index’s worst sessions, each with analyst-projected upside: Kroger (positive in nearly 70% of sharp down days), Southern Company (positive 63%, highest median gain among the screened group), and Cboe Global Markets (positive 75%, with nearly 20% year-to-date gains). Broadly, utilities, consumer staples, and financial market infrastructure firms generate stable earnings across economic cycles, making them natural ballast during turbulent markets. These are not predictions of future performance — they are historical patterns from a specific three-year screening window.
What does the Buffett Indicator actually measure, and how worried should investors be?
The Buffett Indicator compares the total market capitalization of all publicly traded U.S. stocks to GDP — a ratio Warren Buffett in 2001 called “probably the best single measure of where valuations stand at any given moment.” At roughly 236 to 244% depending on the data source, the current reading sits well above every pre-2020 cycle peak and is classified as “Strongly Overvalued” by CurrentMarketValuation.com’s trend-adjusted model. However, the indicator has documented structural limitations: U.S. companies now earn approximately 41% of their revenues overseas, inflating market cap relative to the domestic GDP denominator. And the indicator is a valuation tool, not a timing tool — markets remained elevated by this measure for years before previous corrections without the indicator reliably forecasting their exact onset. Elevated readings indicate elevated long-term risk and reduced expected future returns, not an imminent crash on a defined schedule.